This is a single function call that allows a user to change which format in which
the plots will occur.
Specifically, the two common formats would be to "screen" or to disk as an image file,
such as "png".
This has currently been tested with ggplot2, RasterLayer, and tmap objects.
The default (or change with e.g., fn = "print", usePlot = FALSE) uses
Plot internally, so individual plots may be rearranged. When saved to
disk (e.g., via type = 'png'), then Plot will not be used and the single object
that is the result of this Plots call will be saved to disk.
This function requires at least 2 things: a plotting function and arguments passed
to that function (which could include data, but commonly would simply be named
arguments required by fn).
See below and examples.
Plots(
  data,
  fn,
  filename,
  types = quote(params(sim)[[currentModule(sim)]]$.plots),
  path = quote(figurePath(sim)),
  .plotInitialTime = quote(params(sim)[[currentModule(sim)]]$.plotInitialTime),
  ggsaveArgs = list(),
  usePlot = getOption("spades.PlotsUsePlot", FALSE),
  deviceArgs = list(),
  envir = parent.frame(),
  useCache = FALSE,
  ...
)
Arguments
- data
An (optional) arbitrary data object. If supplied, it will be passed as the first argument to
Plotfunction, and should contain all the data required for the inner plotting. If passing aRasterLayer, it may be a good idea to setnames(RasterLayer)so that multiple layers can be plotted without overlapping each other. When a customfnis used and all arguments forfnare supplied and named, then this can be omitted. See examples.- fn
An arbitrary plotting function. If not provided, defaults to using
quickPlot::Plot- filename
A name that will be the base for the files that will be saved, i.e, do not supply the file extension, as this will be determined based on
types. If a user provides this as an absolute path, it will override thepathargument.- types
Character vector, zero or more of types. If used within a module, this will be deduced from the
P(sim)$typeand can be omitted. See below.- path
Currently a single path for the saved objects on disk. If
filenameis supplied as an absolute path,pathwill be set todirname(filename), overriding this argument value.- .plotInitialTime
A numeric. If
NAthen no visual on screen. Anything else will have visuals plotted to screen device. This is here for backwards compatibility. A developer should set in the module to the intended initial plot time and leave it, i.e., notNA.- ggsaveArgs
An optional list of arguments passed to
ggplot2::ggsave- usePlot
Logical. If
TRUE, the default, then the plot will occur withquickPlot::Plot, so it will be arranged with previously existing plots.- deviceArgs
An optional list of arguments passed to one of
png,pdf,tiff,bmp, orjgeg. This is useful when the plotting function is not creating aggplotobject, e.g., plotting aRasterLayer.- envir
The environment where the
dataargument should be evaluated if it is acall. Normally, this should be left at its default,parent.frame().- useCache
Logical or character vector. If
TRUE, caching is enabled for all non-screen output types. If a character vector, caching is enabled only for the matchingtypes. Default isFALSE.- ...
Anything needed by
fn, all named.
Value
Called for its side effect of plot creation.
Details
type"screen"– Will plot to the current device, normally a plot window"object"– Will save the plot object, e.g.,ggplotobject"raw"– Will save the raw data prior to plotting, e.g., the data argument"png"– or any other type save-able withggsave
Note
This is still experimental and could change in the next release.
Plots now has experimental support for "just a Plot call", but with types specified.
See examples.
The devices to save on disk will have some different behaviours to the screen representation,
since "wiping" an individual plot on a device doesn't exist for a file device.
This offers up to 4 different actions for a given plot:
To screen device
To disk as raw data (limited testing)
To disk as a saved plot object (limited testing)
To disk as a
.pngor other image file, e.g.,.pdf
To turn off plotting both to screen and disk, set both
.plotInititalTime = NA and .plots = NA or any other
value that will not trigger a TRUE with a grepl with the types
argument (e.g., "" will omit all saving).
Recording of files saved
In cases where files are saved, and where Plots is used within a SpaDES module,
the file(s) that is/are saved will be appended to the outputs slot of the
simList of the module. This will, therefore, keep a record of figures saved
within the simList
Examples
# \donttest{
# Note: if this is used inside a SpaDES module, do not define this
# function inside another function. Put it outside in a normal
# module script. Otherwise, it will cause a memory leak.
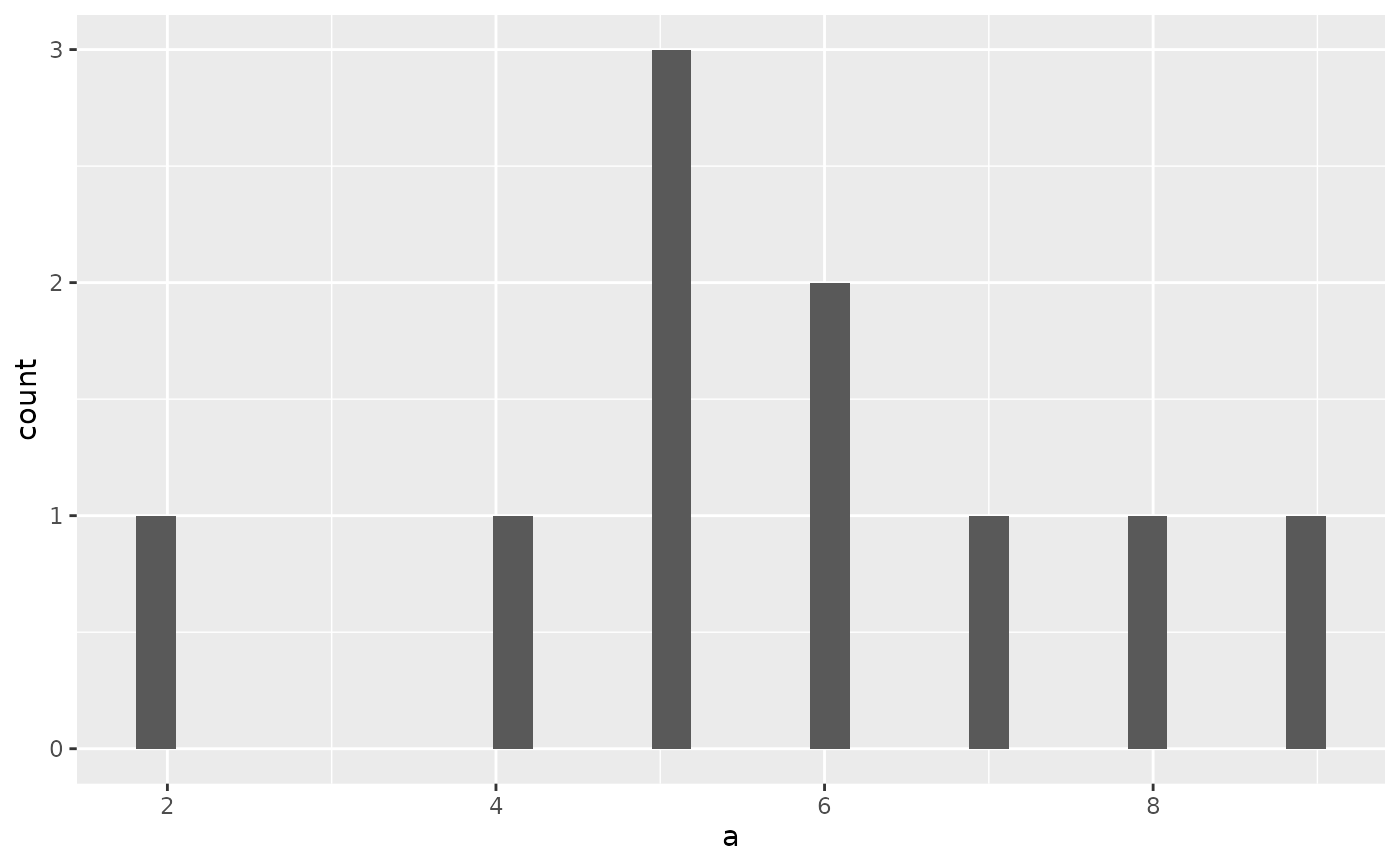
if (requireNamespace("ggplot2")) {
fn <- function(d)
ggplot2::ggplot(d, ggplot2::aes(a)) +
ggplot2::geom_histogram()
sim <- simInit()
sim$something <- data.frame(a = sample(1:10, replace = TRUE))
Plots(data = sim$something, fn = fn,
types = c("png"),
path = file.path(tempdir(), "figures"),
filename = tempfile(),
.plotInitialTime = 1)
# plot to active device and to png
Plots(
data = sim$something, fn = fn,
types = c("png", "screen"),
path = file.path(tempdir(), "figures"),
filename = tempfile(),
.plotInitialTime = 1
)
# Can also be used like quickPlot::Plot, but with control over output type
r <- terra::rast(terra::ext(0,10,0,10),
vals = sample(1:3, size = 100, replace = TRUE))
Plots(r, types = c("screen", "png"), filename = tempfile(),
deviceArgs = list(width = 700, height = 500),
usePlot = TRUE)
# with ggplotify, Plots can also be used to plot/save
# non-ggplot objects:
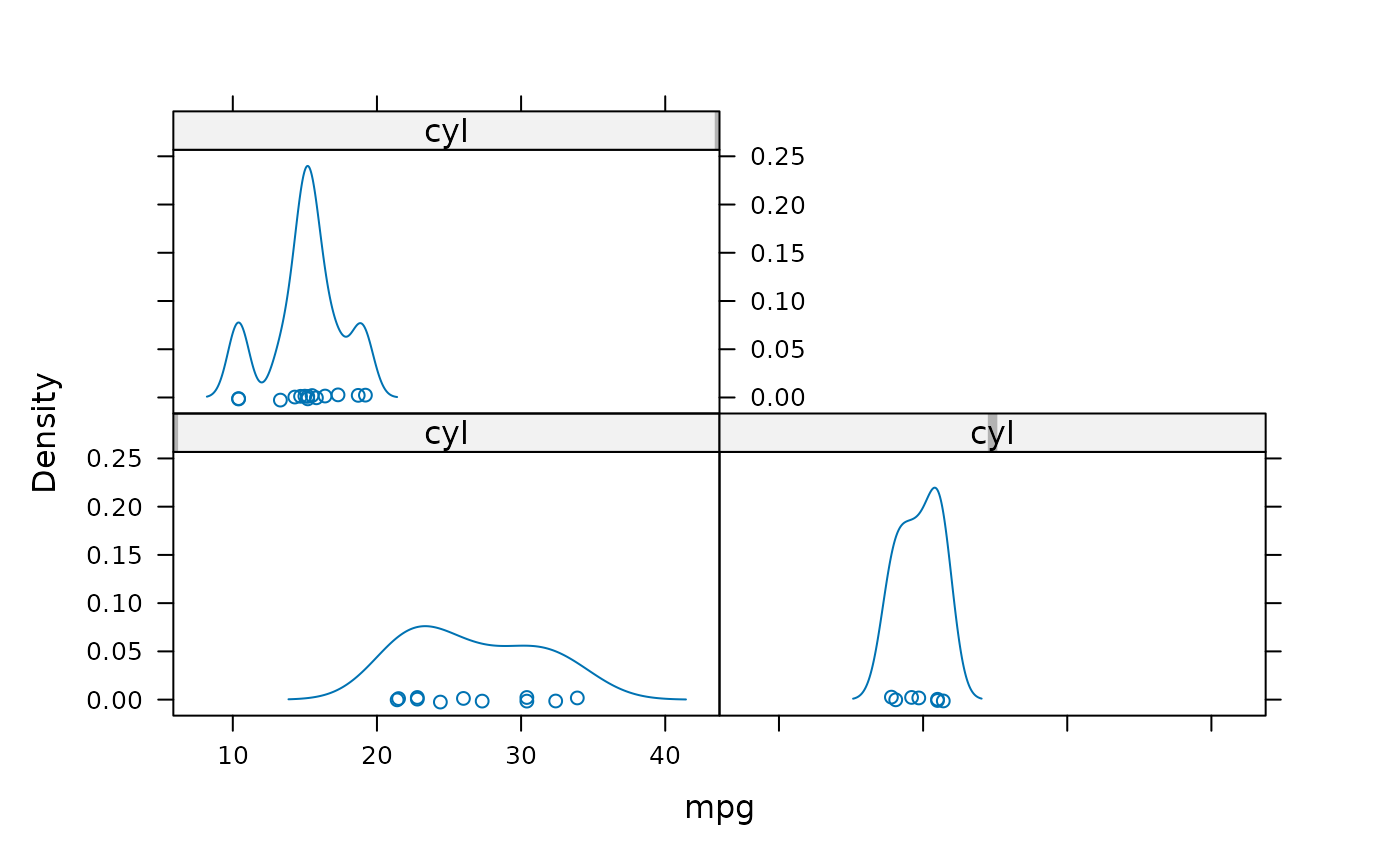
if (require("ggplotify")) {
if (!require("lattice")) stop("please install lattice")
p1 <- densityplot(~mpg|cyl, data=mtcars)
Plots(data = p1, fn = as.ggplot, filename = tempfile(),
ggsaveArgs = list(width = 5, height = 4, dpi = 300,
bg = "white", units = "in"),
types = c("screen", "png"),
.plotInitialTime = 1)
}
} # end ggplot
#> Setting:
#> options(
#> reproducible.cachePath = '/tmp/Rtmp4BAZIc/reproducible/cache'
#> spades.inputPath = '/tmp/Rtmp4BAZIc/SpaDES/inputs'
#> spades.outputPath = '/tmp/Rtmp4BAZIc/SpaDES/outputs'
#> spades.modulePath = '/tmp/Rtmp4BAZIc/SpaDES/modules'
#> spades.scratchPath = '/tmp/Rtmp4BAZIc/SpaDES/scratch'
#> )
#> May20 20:31:23 simInit Using setDTthreads(1). To change: 'options(spades.DTthreads = X)'.
#> Elapsed time for simInit: 0.04587507 secs
#> Saving 6.67 x 6.67 in image
#> `stat_bin()` using `bins = 30`. Pick better value `binwidth`.
#> `stat_bin()` using `bins = 30`. Pick better value `binwidth`.
#> Saving 6.67 x 6.67 in image
#> `stat_bin()` using `bins = 30`. Pick better value `binwidth`.
 #> Saved figure to: /tmp/Rtmp4BAZIc/file2d5f43f3080b.png
#> Loading required package: ggplotify
#> Loading required package: lattice
#> Saved figure to: /tmp/Rtmp4BAZIc/file2d5f43f3080b.png
#> Loading required package: ggplotify
#> Loading required package: lattice
 #> Saved figure to: /tmp/Rtmp4BAZIc/file2d5f7d69df98.png
unlink("figures") # clean up
# } # end of dontrun
#> Saved figure to: /tmp/Rtmp4BAZIc/file2d5f7d69df98.png
unlink("figures") # clean up
# } # end of dontrun